
Daily Market Analysis and Forex News
Markets gripped by tariff turmoil ahead of US CPI

Trump’s reciprocal tariffs go live, including 104% tariffs on China
NAS100 on the cusp of forming “death cross” formation
Over past year US CPI triggered moves of ↑ 1.5% & ↓ 1.8%
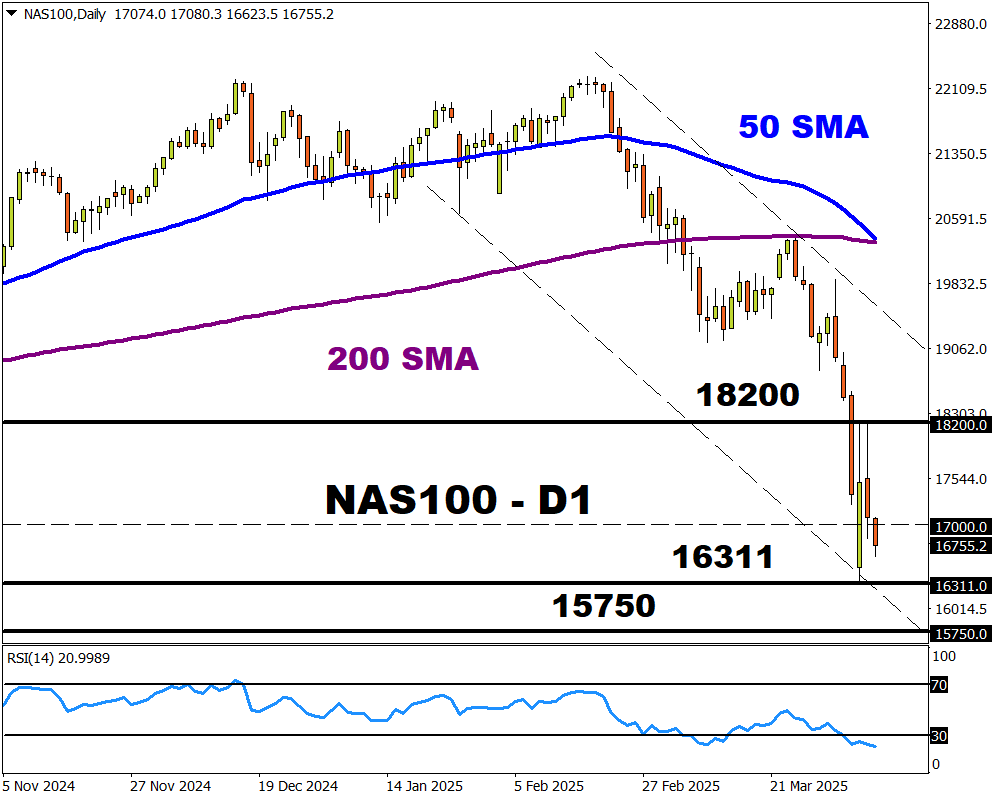
Technical levels: 18200, 17000 &16311
President Donald Trump’s reciprocal tariffs are now in effect, including a massive 104% tariff on China.
This could mean more chaos for markets that have been firmly gripped by uncertainty and mounting trade tensions.
With China vowing to “fight to the end”, fears around a full-blown trade war tipping the global economy into a recession may dent investor confidence.
These concerns are likely to translate to more losses for global equities as investors rush to safety.
It’s not only stocks feeling the pain from Trumps trade war.
- Crude has tumbled to a fresh four-year low this morning, dragging month-to-date losses to nearly 20%.
- FXTM’s USDInd is under pressure, weighed by concerns over the US economic outlook.
Redirecting our attention to equities, the NAS100 is on the cusp of forming a death cross on the daily charts.
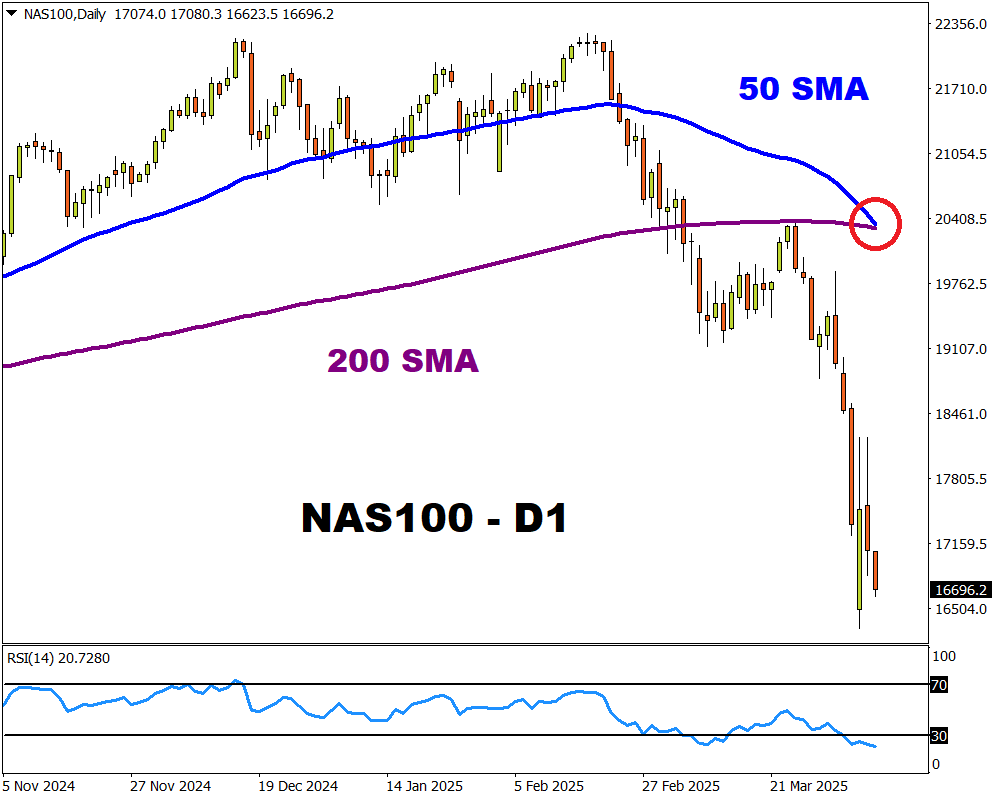
Note: This is a technical event, when an asset's 50-day simple moving average (SMA) crosses below its 200-day SMA – often seen as a technical sign that prices will slip further.
Remember all US equities are feeling the burn:
(Year-to-date performance)
- RUS2000: -21%
- NAS100: -19%
- US400: -18%
- US500: -15%
- US30: -12%
What could move the NAS100 this week:
Beyond the ongoing global trade developments…
- FOMC meeting minutes – (18:00 PM GMT) – Wednesday April 9th
Note: Over the past 12 months, the FOMC minutes have triggered upside moves on the NAS100 of as much as 0.9% or declines of 1.1% in a 6-hour window post-release.
- US March CPI report – (12:30 PM GMT) - Thursday April 10th
Note: Over the past 12 months, the US CPI report has triggered upside moves on the NAS100 of as much as 1.6% or declines of 2.1% in a 6-hour window post-release.
- US April consumer sentiment; March PPI – Friday April 11th
Note: Over the past 12 months, the US consumer confidence report has triggered upside moves on the NAS100 of as much as 1.5% or declines of 1.8% in a 6-hour window post-release.
Technical outlook:
The NAS100 is under pressure on the daily charts with prices wobbling around 17,000. However, the Relative Strengh Index (RSI) signals that prices are oversold.
- Should 16311 prove to be reliable support, prices may rebound back toward 17000 and resistance at 18200.
- Weakness below 16311 may send prices toward the 200-week SMA at 15750.
Ready to trade with real money?
Open accountChoose your account
Start trading with a leading broker that gives you more.