
Daily Market Analysis and Forex News
Is Bitcoin headed for $100k?

Bitcoin ↑ 15% in April
Boosted by trade hopes and Fed cut bets
Bitcoin ETFs see 7th consecutive day of inflows
Over past year NFP triggered moves of ↑ 4.4% & ↓ 4.1%
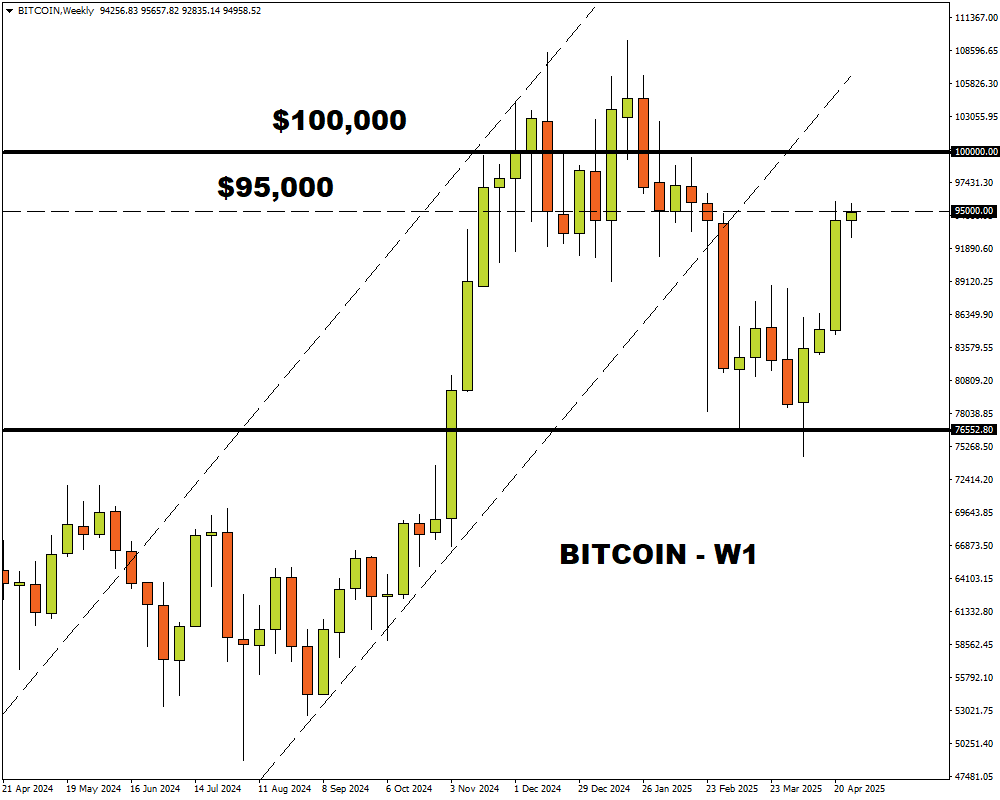
Technical levels: $95,000 & $93,000
Bitcoin surged over 12% last week, bagging its biggest weekly gain since Donald Trump’s US presidential election victory.
The “OG” crypto has gained over 15% since the start of April with prices knocking on key resistance at $95k.
Bitcoin has been boosted by trade hopes and growing bets around lower US interest rates. Another major factor is the consistent inflow into exchange-traded funds holding the tokens.
According to data from Coinglass, Bitcoin ETFs saw $591.2 million inflows on Monday, marking its 7th consecutive day of new inflows.
These bullish forces may keep Bitcoin buoyed ahead of the incoming US GDP, PCE and NFP reports.
As covered in our week ahead report, major US economic data is likely to influence bets around when the Fed cuts rates in 2024.
Traders are currently pricing three Fed rate cuts in 2025 with the odds of a fourth cut by December at 63%.
Any changes to these expectations may influence cryptocurrencies, which have shown sensitivity to interest rates.
- Wednesday 30th April – Q1 GDP, US PCE price index
Note: Over the past 12 months, the US GDP report has triggered upside moves on Bitcoin of as much as 1.9% or declines of 4% in a 6-hour window post-release.
Note: Over the past 12 months, the US PCE report has triggered upside moves on Bitcoin of as much as 1.8% or declines of 4.7% in a 6-hour window post-release.
- Friday 2nd May - US April NFP report
Note: Over the past 12 months, the US NFP report has triggered upside moves on Bitcoin of as much as 4.4% or declines of 4.1% in a 6-hour window post-release.
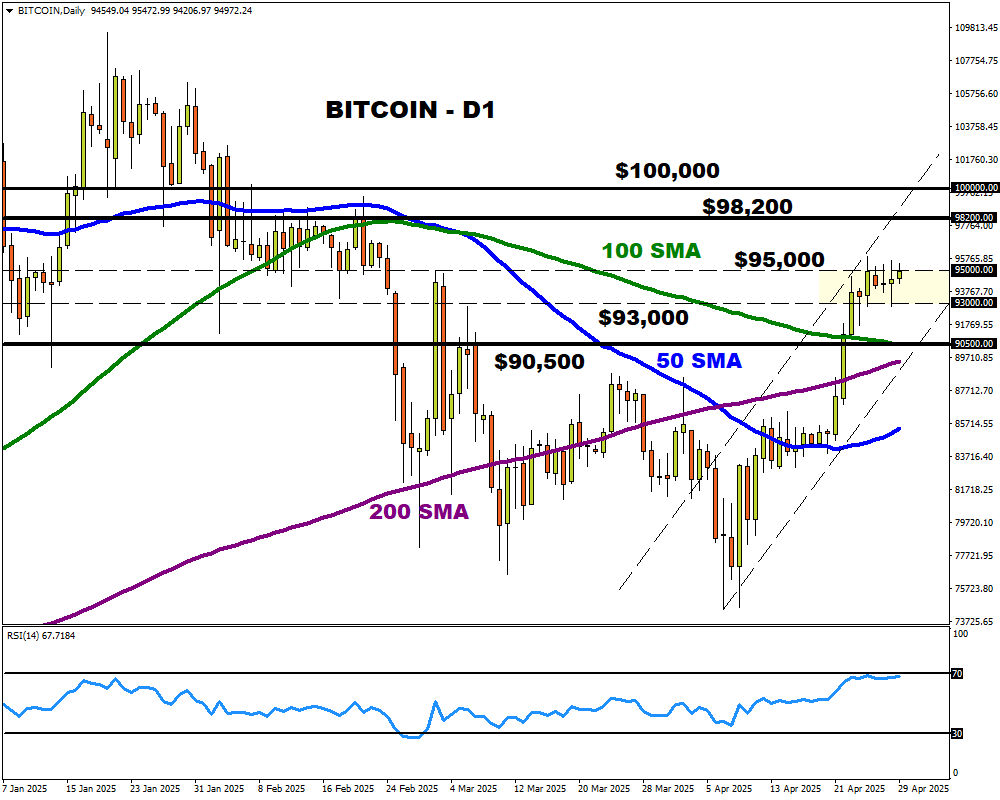
POTENTIAL SCENARIOS:
Bitcoin is bullish on the daily timeframe with prices trading above the 50, 100 and 200-day SMA.
However, key resistance can be found at $95,000 and the Relative Strength Index (RSI) is approaching overbought territory.
- BULLISH: A solid breakout and daily close above $95,000 may open a path toward $98,200 and $100,000.
- BEARISH: Sustained weakness below $95,000 could trigger a decline back toward $93,000 and the 100-day SMA at $90,500.
Ready to trade with real money?
Open accountChoose your account
Start trading with a leading broker that gives you more.